Unlocking the value in your data
The right visualisations can help you unlock and release the value in your data. Visual Topology can help you to create custom interactive visualisations so that your organisation can better understand and act upon its data. We specialise in creating advanced visualisations from structured, unstructured and geospatial data.
Gallery
Risk Finder
The risk finder dashboard is designed to display different kinds of risk that vary over space and time.
For example, we creared an air pollution risk finder dashboard to allow non-scientists to explore the Copernicus Atmosphere Monitoring Service (CAMS) background air pollution forecasts in their local area and across Europe.

Visigoth
Visigoth is an open source, zero dependency python library and the core of our vision for enabling simple or complex HTML documents based on data visualisation driven narratives and interactive features.
Visual Topology comes with standard charts and geospatial map visualisation layers and is designed to be easily extensible. Visual Topology can provide paid support and add custom visualisations.
More information on the visigoth library and how to start using it for free in your projects.


Working with you
Visual Topology will work with you to discover, design and build the visualisations you need. If standard chart and map plots will help, we have that covered, but we specialise in creating complex custom visualisations tailored to your exact needs.
Sophisticated interactive visualisations
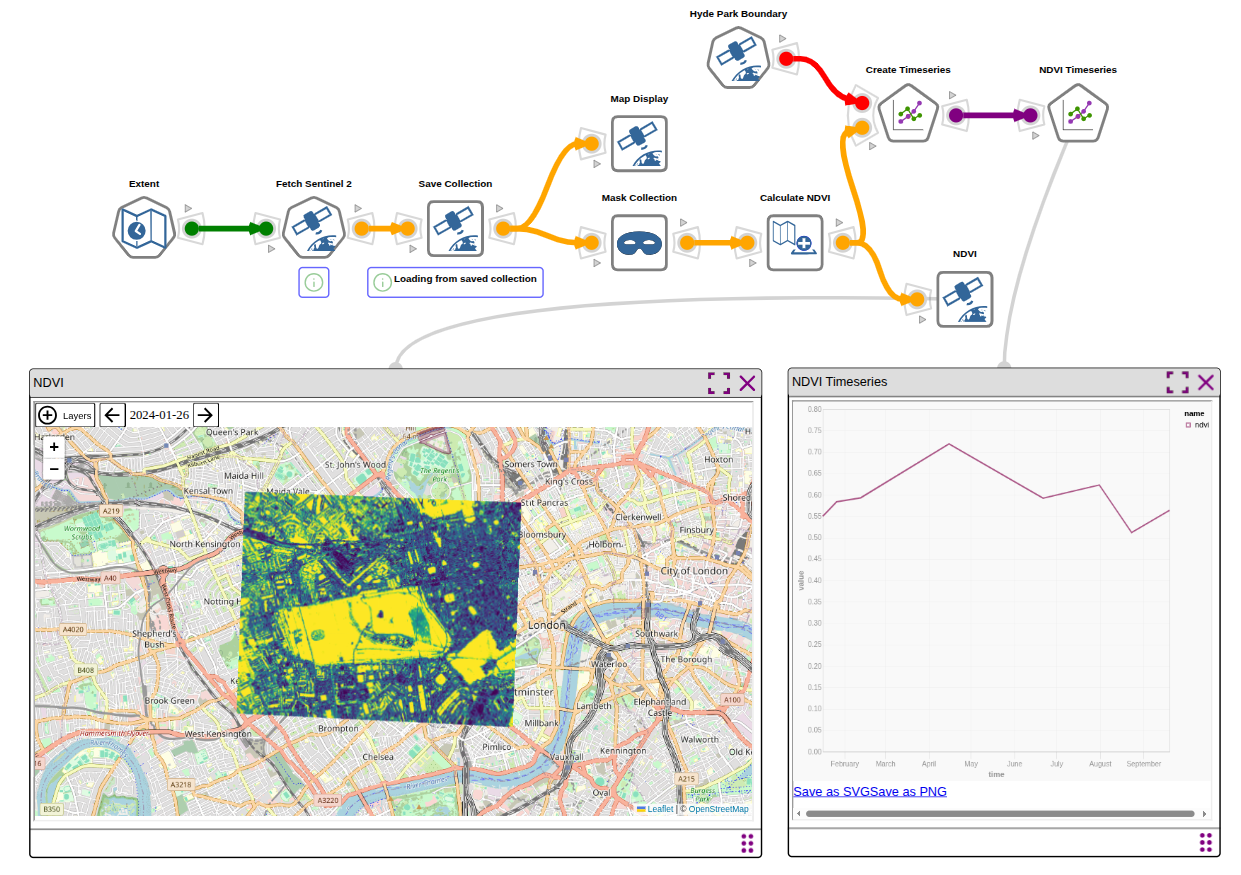
We develop interactive visualisations that are rendered as self contained support vector graphics (SVG) or HTML5 files. Each visualisation can contain multiple embedded charts, maps, images, text and tables.
Easy integration
We deliver re-usable Python code that you can use to generate your visualisations directly from your data. The code can be easily run from the command line or integrated into your organisation's systems.
Working with you
We work closely with your data scientists, software engineers and end users. Each project starts with a discussion of the requirements and the data that is to be visualised. It is important to establish the expected audience(s) and the intended purpose of each visualisation.
After a couple of iterations we can usually arrive at a specification for the project including delivery timelines, pricing and success criteria. Once this has been agreed, development work can begin.
We do not usually use real datasets during the development of a visualisation, but instead will construct one or more mocked up datasets, in order to avoid our clients sharing sensitive, confidential or personal identifiable information. If necessary Visual Topology can simulate sufficiently realistic synthetic data.
Sophisticated interactive visualisations
We can draw on a set of sophisticated algorithms to generate visualisations, including algorithms from the fields of unsupervised learning and graph theory, and have the capability to research and develop novel visualisation algorithms.
When a visualisation is opened in a browser, a range of interactions can be added to help the viewer navigate and find the information they are looking for. Visualisations can also be easily converted to static images or PDF files if distribution in this form is required.
Easy integration
Custom visualisations are supplied as python/javascript/html/css source code which may leverages or extends our Visigoth open source library.
In addition to the python source code, Visual Topology will provide the necessary documentation and assistance to help you integrate the code into your organisation's workflow to create and update your visualisations from the underlying data as needed.